


In the first quarter of 2026, tourism in Canada kept growing, but slowly. Real tourism GDP rose 0.5%, tourism spending in Canada reached CA$28.4 billion (measured in 2017 constant prices), and international visitors now make up 25.4% of all tourism spending, the highest share in this dataset.
The bigger story is where the growth is coming from. Foreign visitors are spending more, while Canadians are spending slightly less at home. That shift kept the overall numbers positive even as domestic demand cooled.
A quick note on the figures: with this release, Statistics Canada updated all past data (2020 to end of 2025) using new 2022 benchmarks. So the numbers below may differ from older reports. Everything here uses the latest, revised figures so the trend stays consistent.
Canada Tourism Statistics At a Glance
- As per the latest available data, 10.10 million international visitors entered Canada in the first four months of 2026 alone.
- Real tourism GDP grew 0.5% in Q1 2026, after a 1.4% rise in Q4 2025. The wider economy grew just 0.1%.
- Tourism made up 1.80% of Canada’s economy (nominal GDP) in Q1 2026, up from 1.77% in Q4 2025.
- Total tourism spending in Canada hit CA$28,435 million, up 0.1% from the previous quarter.
- International visitor spending rose 0.9%, while spending by Canadians at home fell 0.2%.
- Foreign visitors accounted for 25.4% of all tourism spending, up from 25.2% in Q4 2025.
- Tourism jobs grew 0.4%, even as jobs across the whole economy fell 0.3%.
Number of International Tourists in Canada (2026 Data)
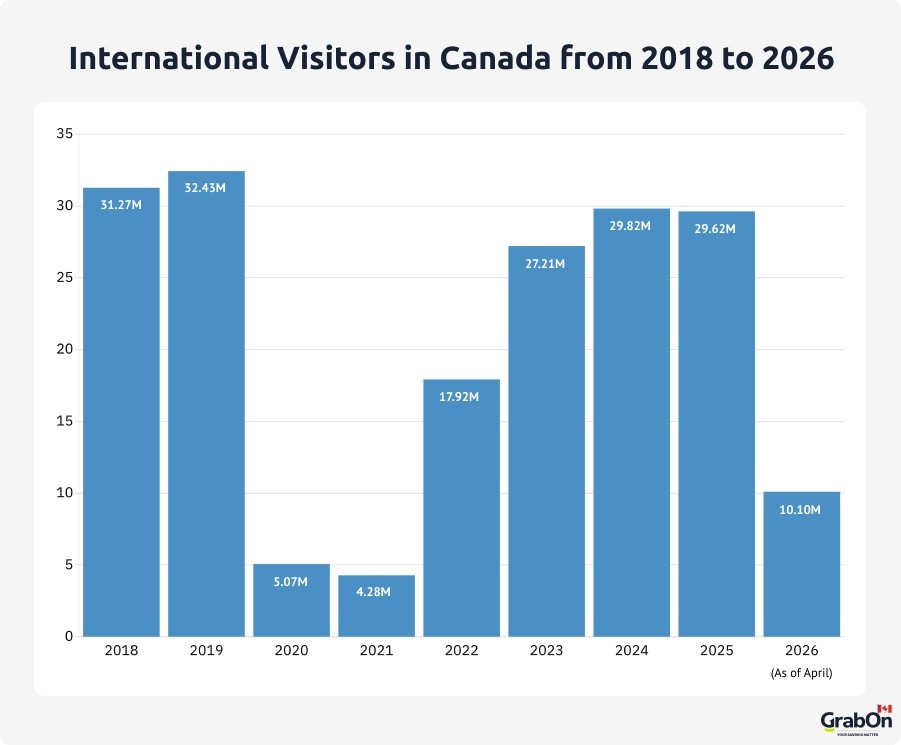
As per the latest available data, 10.10 million international visitors entered Canada in the first four months of 2026. If we take a look back, this count stood at 29.62 million in 2025 and 29.82 million in 2024.
Although there was a downward trend in 2025 from 2024, the overall numbers are improving since the COVID-19 setback.
The pre-pandemic numbers stood at 31.27 million in 2018 and 32.43 million in 2019. During the pandemic, the numbers were 5.07 million in 2020 and 4.28 million in 2021.
Here is a complete breakdown of International Visitors in Canada from 2018 to 2026:
| Year | International Visitors in Canada |
| 2018 | 31.27 million |
| 2019 | 32.43 million |
| 2020 | 5.07 million |
| 2021 | 4.28 million |
| 2022 | 17.92 million |
| 2023 | 27.21 million |
| 2024 | 29.82 million |
| 2025 | 29.62 million |
| 2026 (As of April) | 10.10 million |
Total Tourism Spending In Canada Over the Quarters
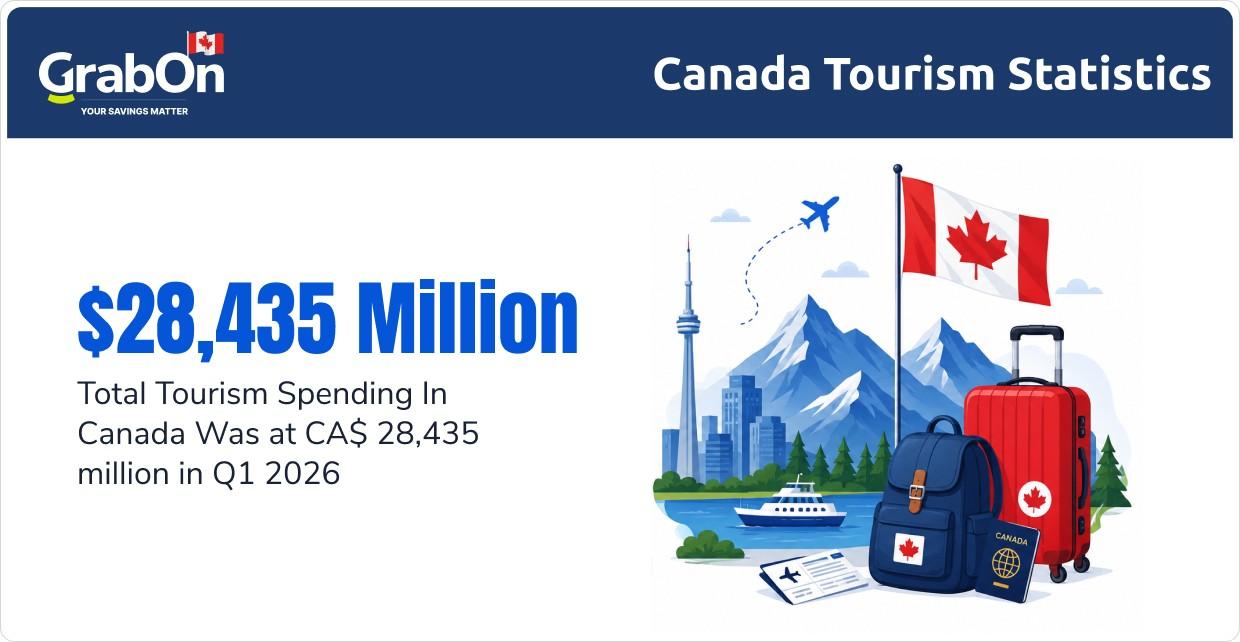
Tourism spending in Canada has climbed for five quarters straight, though the pace slowed sharply in Q1 2026. The table below splits the total into two groups: money spent by international visitors (non-residents) and money spent by Canadians travelling inside Canada (domestic).
Tourism Spending in Canada (CA$ millions, 2017 constant prices)
| Quarter | Total Spending in Canada | International Visitors | Canadian Residents |
| Q1 2025 | 27,474 | 7,034 | 20,440 |
| Q2 2025 | 27,765 | 6,813 | 20,952 |
| Q3 2025 | 27,989 | 6,936 | 21,053 |
| Q4 2025 | 28,412 | 7,163 | 21,249 |
| Q1 2026 | 28,435 | 7,229 | 21,206 |
The trend shows steady growth for most of the year, driven mainly by Canadian residents. Domestic spending rose in every quarter from Q1 to Q4 2025, moving from 20,440 to 21,249 million. But in Q1 2026 it dipped to 21,206 million, the first fall in this run.
International spending moved differently. It dropped in Q2 2025, recovered through the second half of the year, and reached 7,229 million in Q1 2026, its highest point here. So in the first quarter of 2026, the roles flipped: foreign visitors carried the growth while Canadians pulled back slightly. The two effects nearly cancelled out, leaving total spending almost flat at +0.1%.
Where the Money Was Spent (Q1 2026)
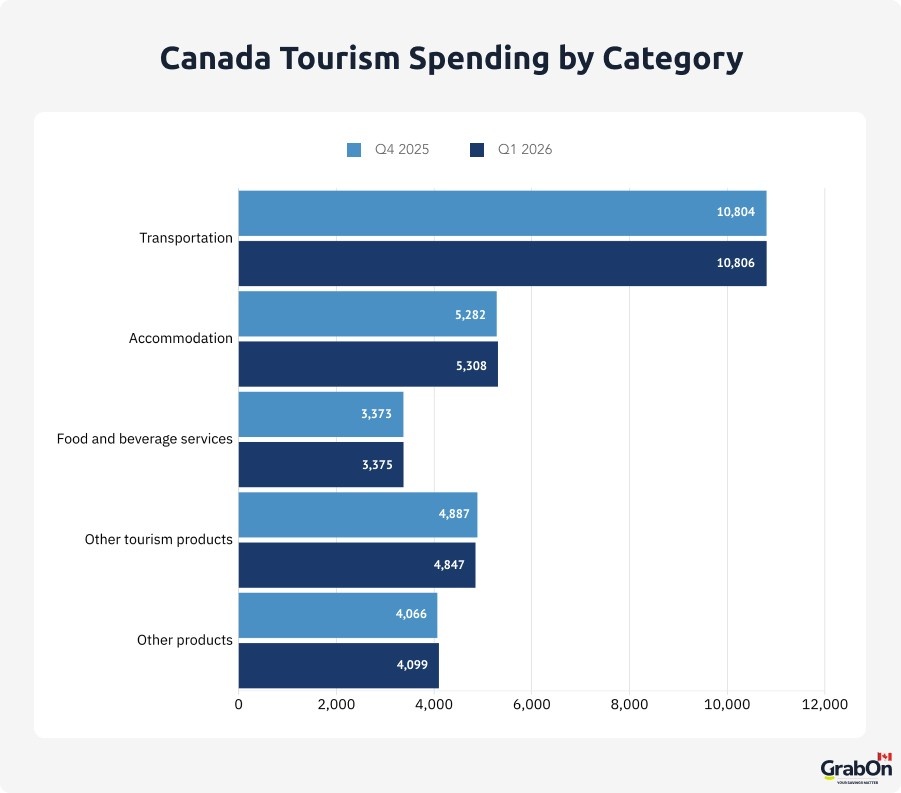
Not every part of tourism grew at the same rate. Some categories rose, a couple fell. The table below shows total spending in Canada by product type, comparing Q4 2025 with Q1 2026.
Tourism Spending by Category (CA$ millions, total demand in Canada)
| Category | Q4 2025 | Q1 2026 | Change |
| Transportation | 10,804 | 10,806 | 0.0% |
| Accommodation | 5,282 | 5,308 | +0.5% |
| Food and beverage services | 3,373 | 3,375 | +0.1% |
| Other tourism products | 4,887 | 4,847 | -0.8% |
| Other products | 4,066 | 4,099 | +0.8% |
| Total | 28,412 | 28,435 | +0.1% |
Transportation is by far the largest category, and it barely moved this quarter. Accommodation was the strongest of the main tourism categories, up 0.5%.
The only real decline was in “other tourism products”, down 0.8%. This category covers travel services and vehicle rentals, both of which fell as Canadians cut back on trip bookings.
International Visitors Are Driving the Growth
Foreign visitors are the clear bright spot. Their spending grew 0.9% in Q1 2026, following a 3.3% jump the quarter before. The table shows where that spending went.
International Visitor Spending by Category (CA$ millions)
| Category | Q4 2025 | Q1 2026 | Change |
| Transportation | 2,443 | 2,456 | +0.5% |
| Accommodation | 1,711 | 1,733 | +1.3% |
| Food and beverage services | 919 | 929 | +1.1% |
| Other tourism products | 892 | 891 | -0.1% |
| Other products | 1,198 | 1,220 | +1.8% |
| Total | 7,163 | 7,229 | +0.9% |
Almost every category rose. Accommodation led the tourism-specific items at +1.3%, followed by food and beverage at +1.1%. Spending on general goods (“other products”, such as shopping) rose the fastest at +1.8%. The only category that slipped was travel services, inside “other tourism products”.
Behind these numbers is a change in who is visiting. Overnight travel to Canada from abroad rose 1.4% in Q1 2026. Travel from the United States grew 3.3%, while travel from all other countries fell 2.7%. So American visitors are now doing the heavy lifting for inbound tourism.
Tourism GDP and Jobs
Tourism keeps outperforming the wider economy on both output and jobs. The table below sets the two side by side.
Tourism GDP and Jobs (quarterly change)
| Indicator | Q1 2026 | Q4 2025 |
| Real tourism GDP | +0.5% | +1.4% |
| Tourism GDP as share of nominal GDP | 1.80% | 1.77% |
| Tourism jobs | +0.4% | +0.5% |
| Tourism as share of all jobs | 3.24% | 3.22% |
Tourism GDP has grown every quarter since mid-2022. Growth slowed to 0.5% in Q1 2026, but that still beat the economy-wide figure of 0.1%. Tourism’s share of the economy edged up to 1.80%.
Jobs tell a similar story. Tourism added jobs (+0.4%) while the economy as a whole shed them (-0.3%). Accommodation was the main source of new tourism jobs. Tourism’s share of all jobs in Canada rose to 3.24%.
The Cross-Border Shift in Canadian Tourism
A big reason domestic tourism has held up is that far fewer Canadians are travelling to the United States. Since early 2025, cross-border trips have fallen sharply, driven by a weaker Canadian dollar, higher travel costs, and a wider “buy Canadian” mood tied to trade tensions. Money that used to be spent in the US is now being spent inside Canada.
Fewer Trips to the United States
| Period | Canadian trips to the US (vs a year earlier) |
| Full year 2025 | -25.4% (29.1 million returns) |
| Late 2025 (car trips) | about -30% |
| January 2026 | about -22% |
The fall has been steady, not a one-off. January 2026 marked the thirteenth month in a row of year-on-year declines. Land and car trips dropped the most, which points to shorter shopping and weekend trips being cut first. One University of Toronto study using mobile-phone data suggested the real drop may be closer to 42%, well above the official figure.
The Money Is Being Spent at Home
As trips to the US fell, spending shifted towards travel inside Canada. The table below shows the rebalancing across 2025.
| Measure (2025 vs 2024) | Change |
| Domestic tourism spending (Canadians at home) | +2.7% |
| International visitor spending in Canada | -0.7% |
| Total tourism spending in Canada | +1.7% |
| Canadian trips to the United States | -25.4% |
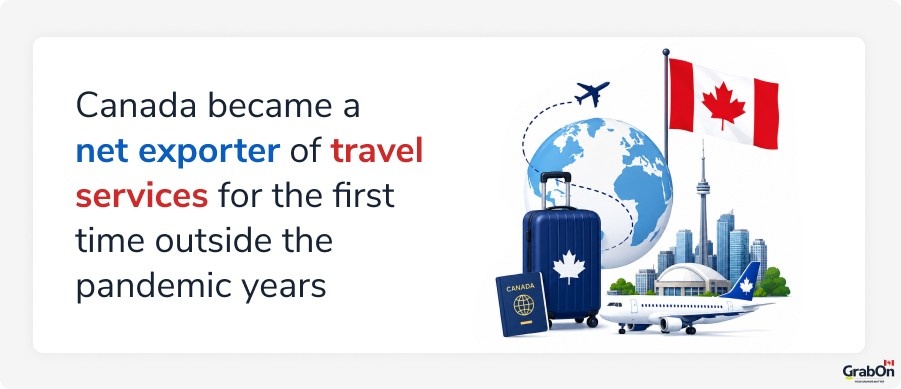
Domestic tourism spending is now around 11% above its 2019 level, before the pandemic. The shift was large enough that in 2025 Canada became a net exporter of travel services for the first time outside the pandemic years, meaning foreign visitors spent more in Canada than Canadians spent abroad on balance. Surveys point to more of the same: about 62% of Canadians said they were less likely to visit the US in 2026.
The Fifa World Cup Effect
This shift lines up with the World Cup to give Canadian tourism two boosts at once in 2026. More Canadians are choosing to holiday at home instead of crossing the border, and the World Cup is drawing large numbers of foreign visitors in June and July. Both point to a stronger domestic and inbound picture in the Q2 and Q3 2026 data, which is not yet published.
The 2025 Full-Year Picture
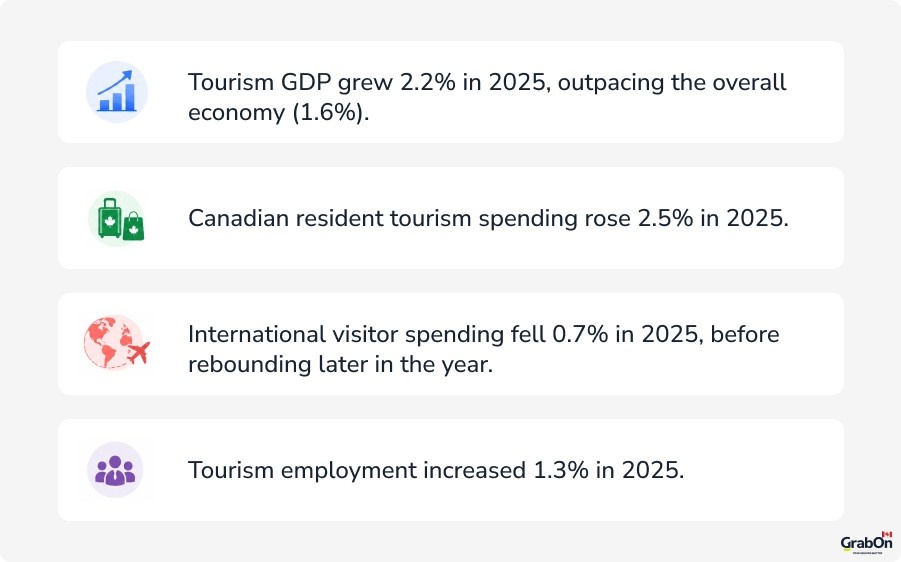
For context, here is how the full year of 2025 looked, based on Statistics Canada’s March 2026 release (before the latest benchmark revision).
- Real tourism GDP grew 2.2% in 2025, ahead of the wider economy at 1.6%.
- Spending by Canadian residents rose 2.5% in 2025, close to the 2.4% seen in 2024.
- International visitor spending fell 0.7% in 2025, held back by a weak first half amid Canada and US trade tensions, before recovering later in the year.
- Tourism jobs grew 1.3% in 2025, down from 1.5% growth in 2024.
Looking Ahead
Early signs for the rest of 2026 point up. Statistics Canada’s frontier counts show the number of non-resident travellers arriving in Canada by land and by air rose in both April and May 2026, compared with the same months a year earlier. Canadian travellers returning home by land and air also increased in both months.
The next official tourism release, covering Q2 2026, is due on 25 September 2026.
Frequently Asked Questions About Canada’s Tourism
How much did tourism spending grow in Q1 2026?
Total tourism spending in Canada rose 0.1% to CA$28,435 million. Growth was small because higher spending by international visitors (+0.9%) was almost fully offset by lower spending from Canadians (-0.2%).
How fast is tourism GDP growing?
Real tourism GDP grew 0.5% in Q1 2026, after 1.4% in Q4 2025. It has grown every quarter since the second quarter of 2022, and it is still growing faster than the wider economy.
What share of tourism spending comes from foreign visitors?
International visitors made up 25.4% of all tourism spending in Canada in Q1 2026, up from 25.2% in Q4 2025. That is the highest share in this dataset.
Which countries are sending more visitors to Canada?
The United States is the main driver. Travel from the US rose 3.3% in Q1 2026, while travel from other countries fell 2.7%. Overall overnight travel from abroad rose 1.4%.
Are Canadians travelling less at home?
Slightly. Domestic tourism spending fell 0.2% in Q1 2026. The biggest drops were in travel services (-6.4%) and vehicle rentals (-10.6%).
Is tourism adding jobs?
Yes. Tourism jobs grew 0.4% in Q1 2026, even though jobs across the whole economy fell 0.3%. Tourism now accounts for 3.24% of all jobs in Canada.
Why do these numbers differ from earlier reports?
With the Q1 2026 release, Statistics Canada revised all data from 2020 to 2025 using new 2022 benchmarks. This blog uses the latest revised figures, so the trend stays consistent across quarters.
Source: Statistics Canada, National Tourism Indicators, Q4 2025 (released 27 March 2026) and Q1 2026 (released 25 June 2026). Figures are seasonally adjusted and shown in 2017 constant prices unless stated. Table 36-10-0230-01.

I go the core of any topic and combine the best so that users don’t have to look elsewhere once they are on my blog.